Create a data driven marketing strategy. Use our findings to select the best technology stack for your apps.
To improve and ultimately perfect an app, marketers need to select the right SDKs – Software Development Kits. However, in today’s marketplace app developers are literally inundated with SDK choices, making it difficult to choose the best ones.
The Mobbo Power Index offers app publishers and marketers robust benchmarks of mobile app SDK components, helping them to make informed decisions about the best technology stacks. The report sheds light on the scale and performance of popular SDK components and tracks the movers and shakers in the mobile industry. This research has been conducted after studying a database of over 2 million analyzed apps, and 1,000 SDK components scanned across iOS and Android and all categories, making it the most in-depth study to date.
The findings provide valuable information for app publishers in their quest to pinpoint the best SDKs to integrate with, as well as for service providers in the mobile app economy who want to understand the competitive landscape in their field.
Key Findings:
63.4% of apps on Android have implemented an in app advertising SDK component, which seems to become a must-have component of any mobile app monetization stack.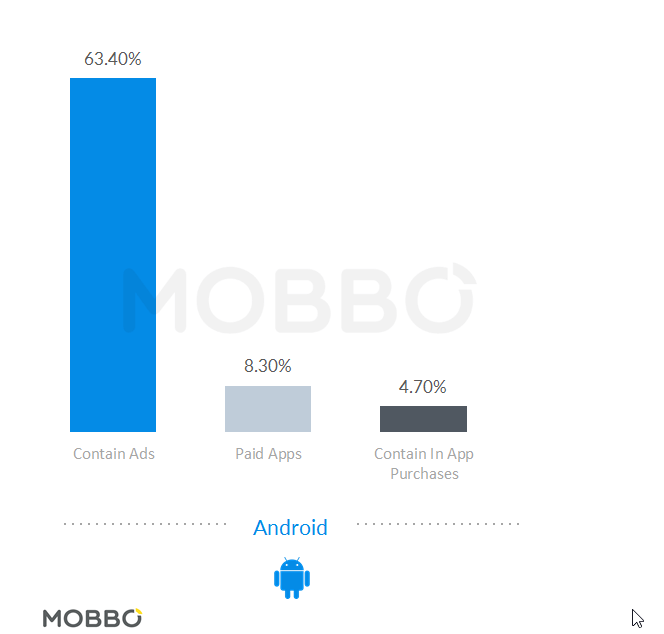
Admob dominates with 83.1% of the Android Share of voice, and 78% share on iOS globally, followed by Chartboost with 25% SOV (Share of voice) on Android and 35% on iOS. Facebook Audience Network is close behind with 24% SOV but on iOS it’s only at 8th place with 6.5% SOV.
The distribution of the monetization SDKs is very different on each platform, AppLovin is very popular on iOS (20%) but on Android they drop to just 12% SOV while Startapp figures on Android surpass iOS with 19% on Android and 5% SOV on iOS.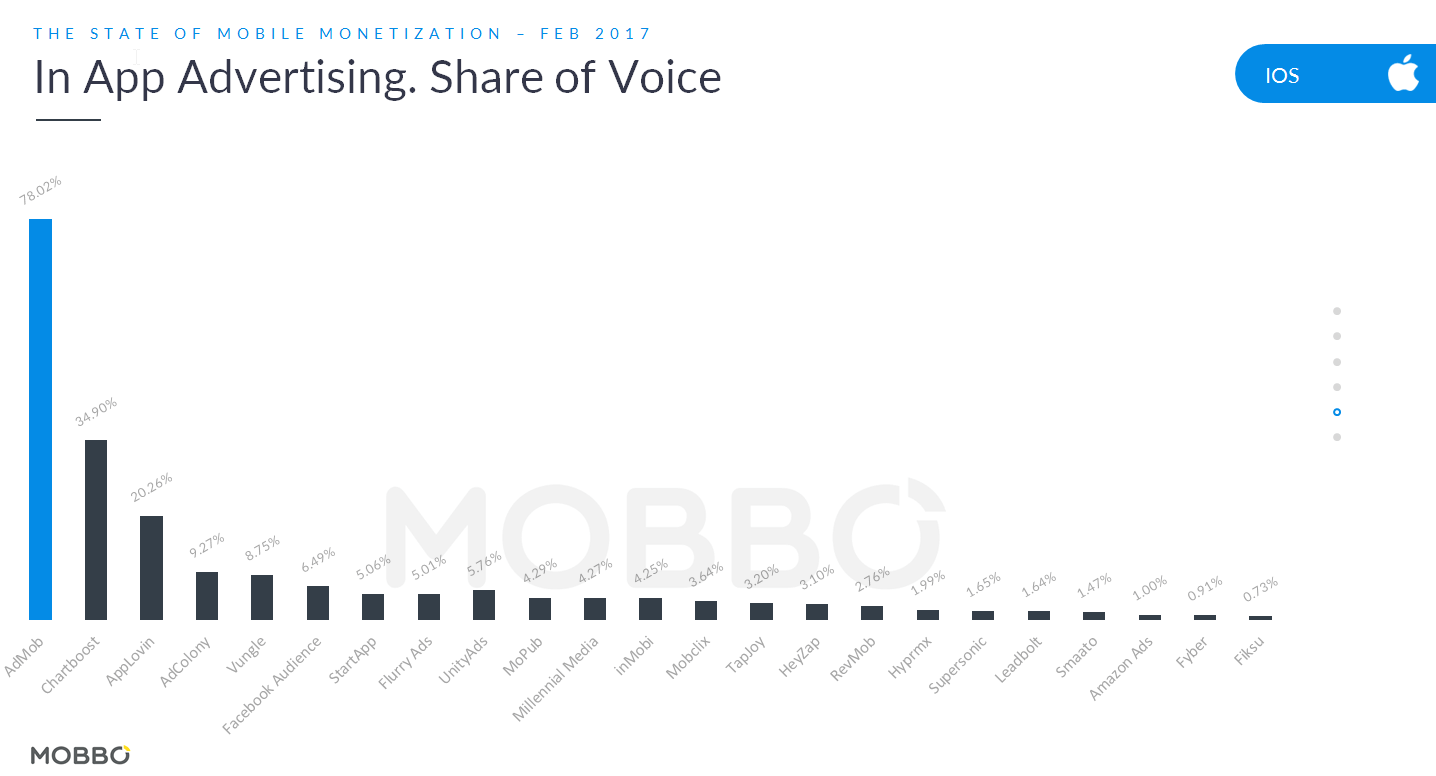

Cheetah Mobile leads the Growth rate chart with 122.72% Growth during Q4, delivering unrivaled scale and impressive retention on Android, followed by Avocarrot with 81.96% and Supersonic (by Ironsource) with 79.45%. 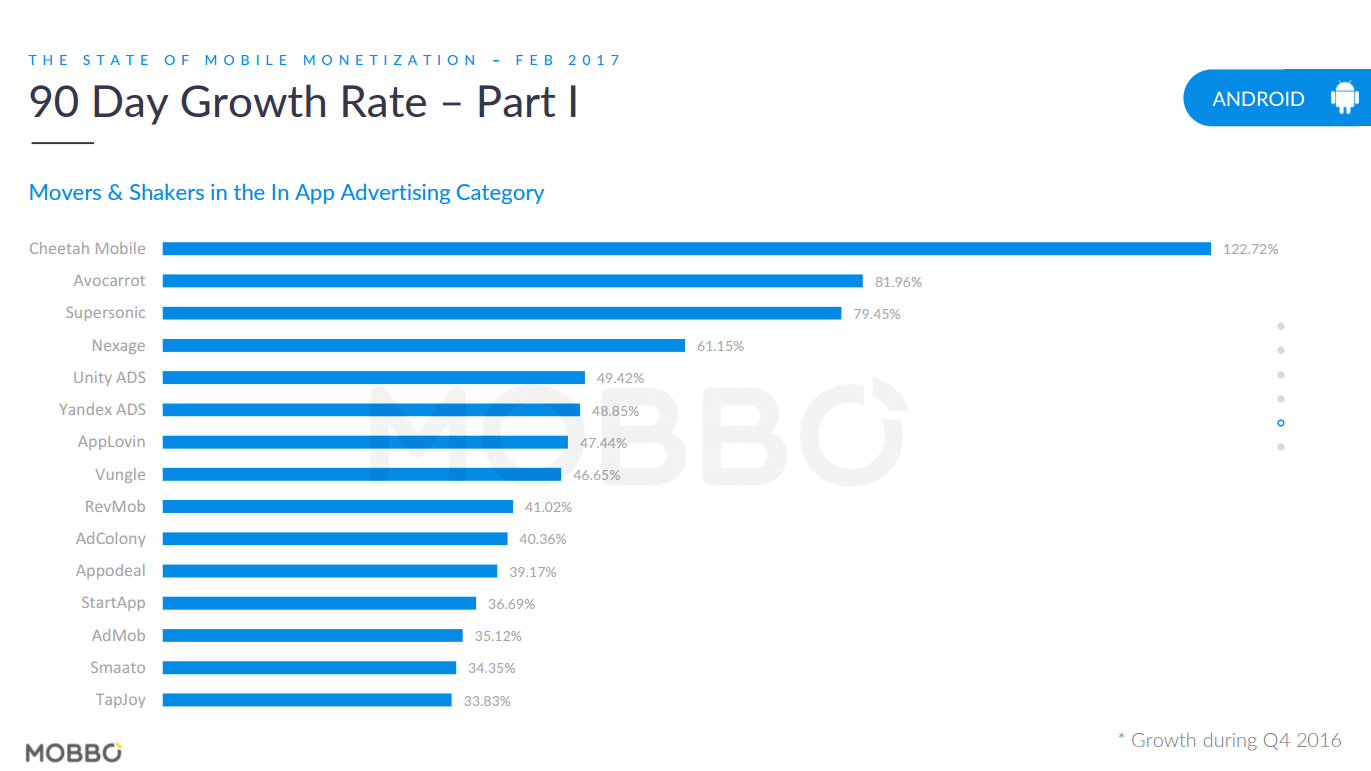
This category is dominated by game centric monetization solutions as we can clearly see from the data with more SDKs being deployed in games, rather than in apps.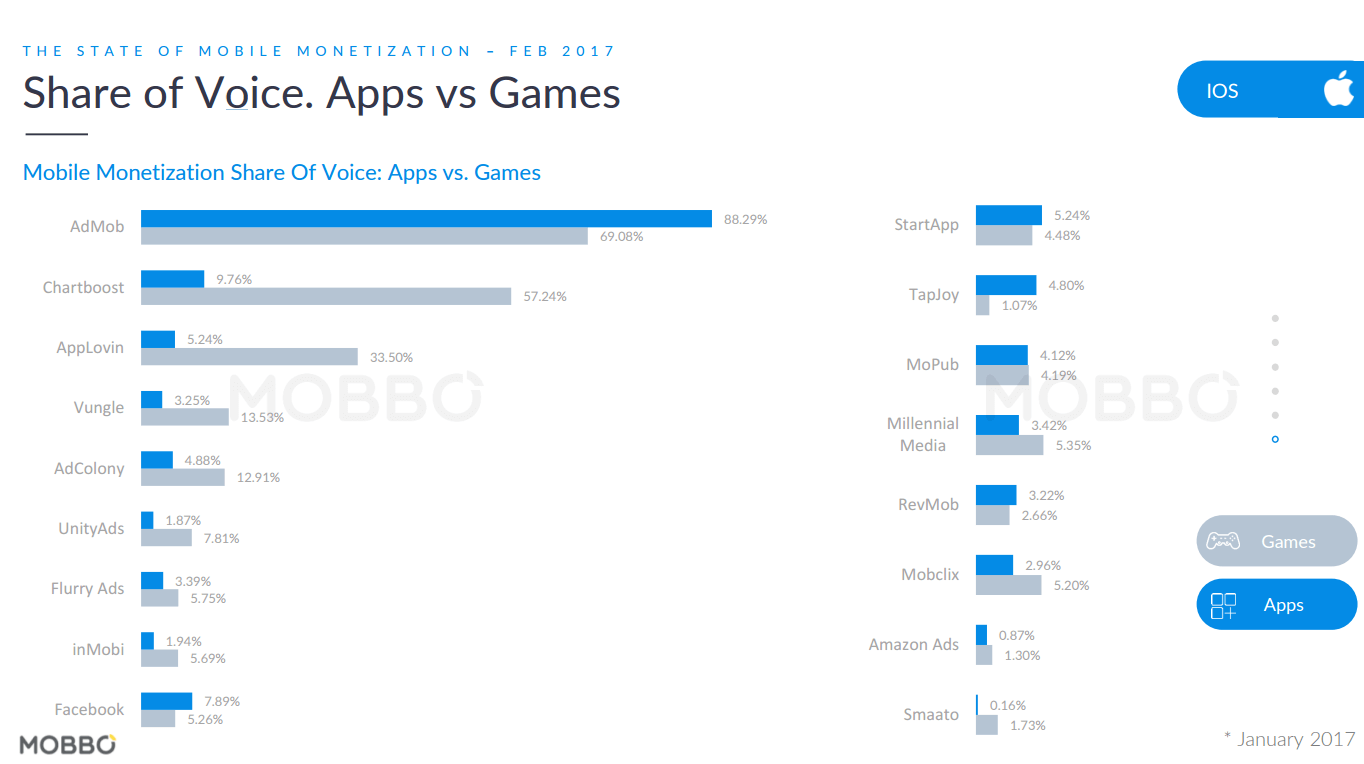
As we can see iOS apps are characterized by low removal rates may be due to the long updating process on iTunes. 
Download our complimentary study, and get started with mobile monetization:
Click Here To Get The Free WhitePaper